Wednesday, March 31, 2021

The Economics of Vending Machines

Zachary Crockett at the Hustle has a nice description of the economics of owning and operating vending machines. It is a fascinating look at an industry I would never have known about otherwise. 

There are about 2 million in operation in the US generating $7.4 billion in annual revenue for nearly 18,000 businesses that own them. Most owners run small operations as sole proprietors but Coke and Pepsi have vertically integrated into owning their own machines. The business scales well which allows for a gig workers type of entrepreneurship.


Owners rent space for their machines mostly in manufacturing plants, offices, hotels, and hospitals and typically pay a percentage of gross revenue. The biggest decisions are what to stock and where to locate them.

Tuesday, March 16, 2021

Which cities have the cheapest house prices?

From chapter 9, we know that in the long run a mobile asset has to be indifferent to where it is used, otherwise it will move.  This long-run indifference principle means that in the long run, you should be indifferent about where to live and whether to own or rent.  In particular, the price-to-rent ratios should reflect this "indifference," and be  similar across cities.  However, this is is certainly not the case.  Here are the most expensive cities:

CityPrice-to-Rent
Ratio
Home Price
(for a $1,000 Rental)
San Francisco, California50.11$601,362
Oakland, California41.05$492,611
Honolulu, Hawaii39.50$474,014
Los Angeles, California38.59$463,135
New York, New York36.83$441,987
Long Beach, California36.37$436,385
Seattle, Washington36.07$432,862
San Jose, California33.77$405,263
Washington, D.C.33.76$405,070

and the cheapest ones:

Indianapolis, Indiana13.18$158,161
El Paso, Texas12.79$153,486
Lubbock, Texas12.78$153,333
Baltimore, Maryland12.43$149,179
Milwaukee, Wisconsin12.43$149,146
Corpus Christi, Texas12.14$145,670
Pittsburgh, Pennsylvania11.14$133,622
Buffalo, New York10.66$127,862
Toledo, Ohio9.68$116,148
Memphis, Tennessee9.53$114,368
Cleveland, Ohio8.31$99,716
Detroit, Michigan5.35$64,194


NOTE:  this is not the "owner equivalent rent" which includes the opportunity cost of owning, it is a much simpler calculation than that,

median home value ÷ median annual rent = price-to-rent ratio

South Lake Tahoe: when housing inventory is low, price increases


More evidence of adjustment in the housing market to changes in demand and supply.  The Pandemic has increased demand for housing, taking the available supply of houses to buy (blue line) to historic lows.  Price increases (red line) generally follow.  The seasonal spikes are due to increases in seasonal demand for vacation houses (higher in summer).  South Lake Tahoe has a large percentage of second (vacation) homes. 

CalculatedRisk is a good blog to follow if you are interested in real estate.  

Housing Bubble-ology: is this time different?

 The WSJ is apparently reading our blog: (earlier blog post)

The Pandemic Ignited a Housing Boom—but It’s Different From the Last One

Residential home sales are hitting peaks last seen in 2006, just before the bubble burst, but this time mortgages are stricter, down payments are higher, and a tight supply is supporting prices

Sunday, March 14, 2021

Mask moral hazard?

According to an AP article, "Virus Tolls [are] Similar Despite Governors' Contrasting Actions." The article suggests moral hazard is the cause:

Some people voluntarily were “being more vigilant in states where the guidelines are more relaxed,” said Thomas Tsai, an assistant professor at the Harvard T.H. Chan School of Public Health.

In other words, in states where it is safer, people take more risks.   

Saturday, March 13, 2021

Is the recent 10% house price increase going to stick?


Last year, house prices in my zip code increased by about 10%; and they are forecast to increase another 10% this year.  This "tightness" or "seller's market" is indicated by the small available supply relative to demand, as indicated by the 2.1 months of inventory.  [NOTE:  months of inventory=(# houses for sale)/(selling rate per month)].  

In the scatter plot below, we see that an inventory of 2.1 months (vertical axis) is normally associated with about a 1.5% monthly price increase (horizontal axis).  The increase in housing demand caused by the lockdowns, as working from home increases demand for bigger living spaces, or for owning a bigger home instead of renting a smaller apartment, is probably behind the price appreciation.  And if you can explain a price change with demand and supply it is likely due to "fundamentals," rather than a "bubble," prices not tied to fundamentals.  


If this is a permanent increase in housing demand then the 10% price increase will likely "stick."  But if this is a temporary increase in demand, which reverses when the pandemic and lockdown ends, we may see a drop in price.  

BOTTOM LINE:  housing price changes are explained by demand and supply changes, but adjustment is relatively slow in this market.  

Wednesday, March 10, 2021

Housing Bubble-ology: is this time different?


Famed Bubble-ologist Robert Shiller called "bubble" on the housing market in 2006 based, in part, on graphs like the one above, showing the relative prices of owning relative to renting.  We know from Chapter 9 that, in long-run equilibrium, a mobile asset has to be indifferent as to where it is used, otherwise it will move.  Here, think of the mobile asset as either people, who can rent or own, or houses and apartments that can be rented or sold.  

In the graph above, the current housing price of owning is 25% higher than the equivalent price of renting, the highest it has been since 2006.  However, what is different this time is that supply is really limited.  Due to the increase in demand for housing driven by the pandemic (people spending more time at home want bigger, nicer homes), houses are in short supply.  And zoning restrictions prevent supply from expanding so in the short run, so the only thing that can adjust is price. 

I would expect price to keep rising until the adjustments described in Chapter 9 occur (supply expands or people move to other cheaper locations, or go back to smaller houses and apartments after the pandemic).  

DISCLAIMER:  Of course, if I really knew, I wouldn't be teaching school and I probably wouldn't tell you.  

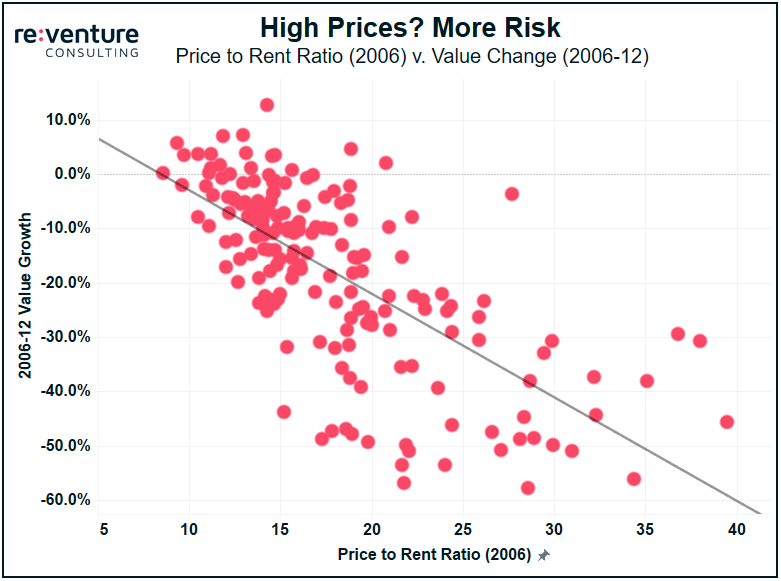
UPDATE:  Cities with lower price-to-rent ratios experience higher price growth


Monday, March 8, 2021

Hiring the Right Bridesmaid

Jen Glantz is an entrepreneur and founder of the company Bridesmaid for Hire. (There is a market for everything). Lots of people wanted her service and even more wanted fill the role, about 70,000 would-be bridesmaids. How to screen all of the applicants? You might think that having been an actual bridesmaid would be important. As she describes in this article, not so much.

Instead, I like to find people who have experience in sales (so they have top communication skills and the ability to read and react to situations), working in high-stress environments (because what wedding isn't high-stress?), and work well with groups of people (whether they've managed teams or worked one-on-one with lots of people before).

There are multiple rounds of employee screening to sift out those just in it for the perks and parties, those who can't think creatively in real-life wedding scenarios, and finally, those who don't pass the in-person social situation test. "If 10 people a year make it to round three, only one might be hired."

Hat tip: Marginal Revolution

Why are there no public toilets in the US?

John Cochrane has another clever metaphor of what is wrong with America.
Activists decide free toilets are a human right, and successfully campaign to ban pay toilets. For a while, existing toilets are free. Within months, upkeep is ignored, attendants disappear, and the toilets become disgusting, dysfunctional and dangerous. Within a few years there are no toilets at all. Fast forward, and we have a resurgence of medieval diseases that come from people relieving themselves al fresco.

Thursday, March 4, 2021

Really Complex Pricing


A Chinese restaurant in West Philly called Danny's Wok has the weirdest pricing structure for chicken wings. The price per additional wing may fall ever so slightly, but will rise every so often so that the average price per wing never falls much. It was so weird, it generated some buzz as many on twitter tried to make sense of it.


And at least a dozen people on twitter have tried to describe it. Some of my favorites are from math twitter:

Or from folks simply graphing the menu prices.


Perhaps, this was not  form of price discrimination after all but merely a clever ploy to get a bunch of free word-of-mouth marketing. Toward this end, it worked wonderfully.


Tuesday, March 2, 2021

Vaccine Tourism


Lufthansa is eyeing the prospect of flying customers in and out of Moscow for the sole purpose of receiving the Sputnik V vaccine against COVID-19. The offer would include two round trip tickets for the two dosses from various European cities and be priced at about 1000 euros.

I was wondering when market forces would enter into COVID-19 vaccine distribution. Most countries are distributing it free to recipients and so have developed rationing mechanisms. Market mechanisms, like this one, ration by price. Since the wealthy and health compromised would have higher willingness-to-pay, more of them would expected to "jump the line." The Lufthansa proposal is merely the most overt example of vaccine line jumping. I suspect that the wealthy have been able to get vaccinated early either by pulling strings behind the scenes or simply using the black market.

John Cochrane has outlined a much more free market approach and claims it would have saved hundreds of thousands of lives.