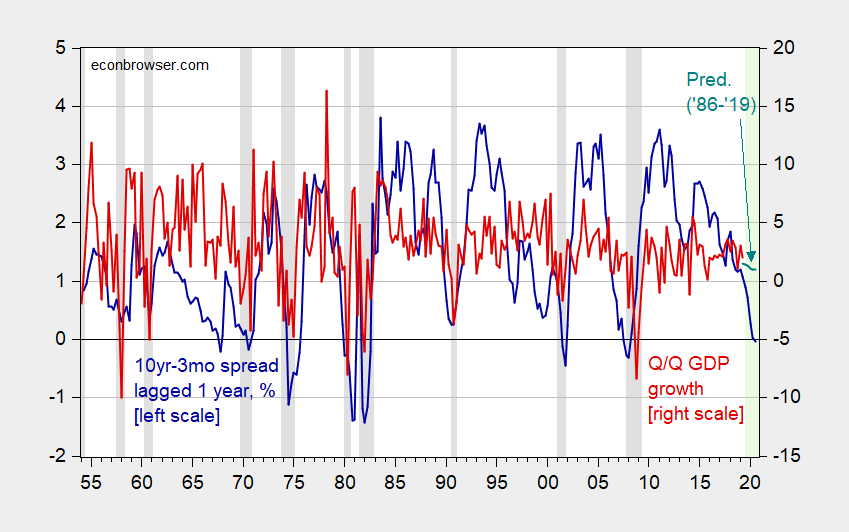
In the graph above, we plot two time series, the percentage growth in GDP (in red) and the difference between long and short term interest rates (in blue). The red series has a mean somewhere between 1% and 2%. The so-called "
yield curve" (in blue) is usually positive to account for the greater risk of long term bonds.
In all of past recessions in the graph, when the blue line has dipped close to zero before the red line goes negative. Recently the difference has approached zero, which could be a signal of a coming recession.
Here is the theory:
Under unusual circumstances, investors will settle for lower yields associated with low-risk long term debt if they think the economy will enter a recession in the near future. For example, the S&P 500 experienced a dramatic fall in mid 2007, from which it recovered completely by early 2013. Investors who had purchased 10-year Treasuries in 2006 would have received a safe and steady yield until 2015, possibly achieving better returns than those investing in equities during that volatile period.
In other words, (i) if the alternative to holding treasuries is investing in the stock market, and (ii) you expect the stock market to fall in the the short term, then get out of equities into long-term bonds. This drives up the price of long-term bonds. Higher bond prices imply a lower yield because yield=(bond payment)/price.
NOTE: there is one "false positive" for this indicator, in 1967, when the dip in the yield curve did not signal an immediate recession.
DISCLAIMER: If I really knew that a recession were coming, I wouldn't be teaching school, and I probably wouldn't tell you.


